Studio analysis: spectra, stereo phase and time-domain measurements
Calibrated display research behind the native StudioAnalyzer and its six complementary views.
Technical research · edition 2 · reviewed 2026-10-24
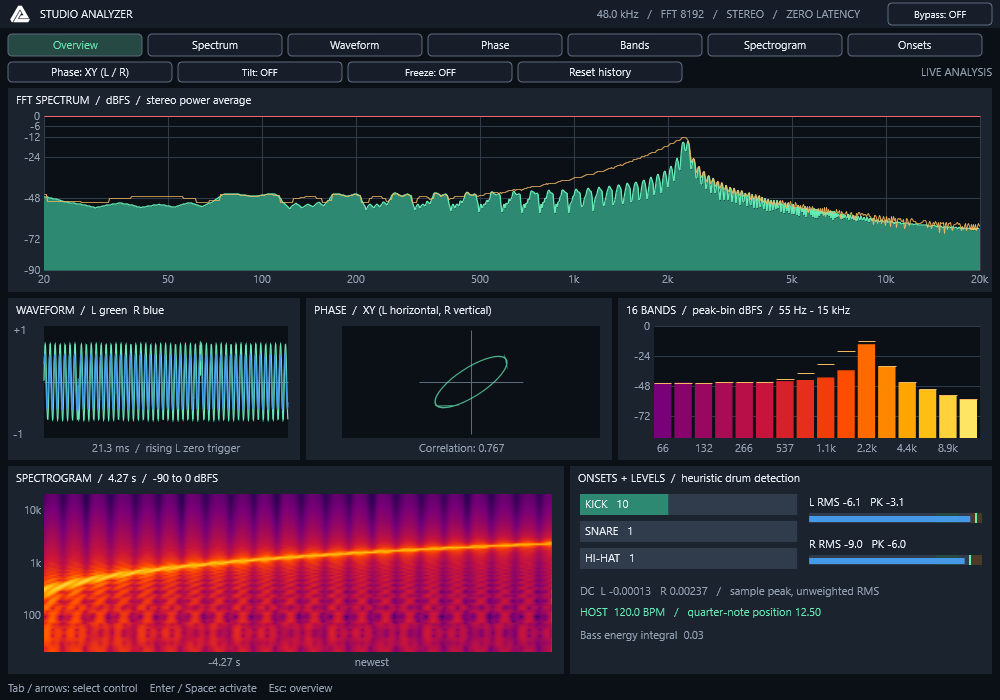
Prismal Labs native editor capture, illustrating the corresponding software project. View full-size image
What we found
Porting the analyzer exposed calibration errors that an attractive spectrum could hide. The pink-noise tilt had the opposite sign to its stated purpose, FFT bins needed coherent-gain correction, and averaging stereo samples before measuring the spectrum would cancel anti-phase content. We corrected those behaviors and checked them against independently generated signals.
The useful findings are measurement contracts: what a displayed dB value means, how stereo is combined, which clock advances analysis, and what happens when the UI falls behind. These can be reused in visualizers and metering tools without copying the interface.
The corrections and their numerical expectations
Source references in PrismalWeb's prismalweb/src/:
components/site/vizPresets/studioAnalyzer.ts, components/site/vizPresets/audio.ts,
lib/phaseScope.ts, components/site/StudioAnalyzerCanvas.tsx and StudioAnalyzerApp.tsx.
- The source's pink-noise correction uses
3 * log2(1000 / frequency). That boosts bass and cuts treble, opposite the stated purpose. This port uses3 * log2(frequency / 1000), anchored at 1 kHz, and makes it optional. - Native FFT values explicitly compensate Blackman coherent gain and the one-sided amplitude factor. A coherent 0.5-amplitude sine reads -6.0206 dBFS in its FFT bin and approximately -9.03 dBFS RMS. DC and Nyquist are not doubled. Pixel power averaging/window scalloping can put the plotted curve below the individual-bin tone amplitude; this is an amplitude spectrum, not a PSD meter.
- Waveform, RMS and bands use floating-point samples/spectra, replacing byte quantization and byte-frequency levels tied to the browser's dB range.
- Both channels come from the same audio sample index. No synthetic R delay,
independent analyzer reads, DC subtraction, or per-axis gain is introduced.
Mono duplicates L into R. Mid/side is
(L-R)/2, (L+R)/2. - Spectrum uses
(powerL + powerR)/2, preserving anti-phase content. Frequencies above the current Nyquist limit have no displayed signal. A right-only signal reads 3.01 dB below a tone present at the same amplitude in both channels. - Flux and history update at an audio-driven approximately 60 Hz cadence, not animation-frame cadence. The onset detector ports the source's regions, median/MAD thresholds, energy gates, competition, falling-edge peak selection and kick-decay confirmation. Absolute gates now consume calibrated amplitudes; behavior is heuristic and is not promised to match the web detector exactly.
- Host transport replaces web playback metadata/offline BPM, drum profiles and beat maps. Missing host tempo is shown explicitly; no synthetic BPM is invented. File upload, playback, microphone/browser capture, website controls and server analysis remain outside a host-insert metering effect.
Evidence: StudioAnalyzer/README.md.
Deriving the stereo amplitude calibration
For windowed DFTs X_L[k], X_R[k] and window sum G=sum(w[n]), an interior one-sided bin uses:
At DC and Nyquist the factor 4 becomes 1 because those bins are not doubled in amplitude. The test computes a direct DFT independently of the packed FFT and compares selected bins to 1e-6 dB. It also compares cached interval power with direct sums.
A coherent amplitude-0.5 sine therefore has amplitude level 20*log10(0.5) = −6.0206 dBFS; its RMS is 0.5/sqrt(2), about −9.0309 dBFS. Equal left/right and equal opposite-polarity left/right must have the same power spectrum. A right-only signal has half the stereo-average power and reads approximately 3.0103 dB lower. These checks distinguish a calibrated amplitude spectrum from a power spectral density estimate.
The display must not control the audio clock
process() copies raw paired samples to a fixed single-producer/single-consumer
queue in 512-sample packets. It performs no FFT, heap allocation, lock, I/O, message
creation or host/UI call. The controller polls using VST3 main-thread IMessage
notifications while an editor is open. All FFTs, onset analysis and rendering run
on that thread. No IPC, global instance registry, or cross-product coupling is used.
The queue holds 127 packets. Each poll retains at most 16–64 pending packets (50 ms at the host rate, with an 8192-sample minimum and a 32768-sample ceiling). It discards excess visualization backlog in constant time and processes no more than that budget. Sequence discontinuities reset analysis; audible processing never waits. Closing the editor pauses analysis consumption. Reopening may briefly show the retained end of the old queue before fresh packets reset it. Offline renders are transparent but their visualization is best effort.
One planned complex FFT computes both real channels' average power. Cached linear
power supports spectrum intervals and onsets without repeated dB conversions;
quiet intervals use direct summation when prefix subtraction would lose precision.
The spectrogram retains 264 columns and shows a 256-column window. Its mirrored
bitmap allows one contiguous draw without a seam at the wrap point. A monotonic
presentation clock scrolls fractional columns on a 16 ms timer, with roughly
50 ms of display buffering to absorb batched data delivery. Filtered subpixel
translation smooths movement; audio latency remains zero. Only the spectrogram
plot receives the additional animation repaints. Polling and other panels remain
approximately 30 Hz. Freeze holds the exact fractional position. Waveform/phase paths and spectrum strokes are batched. Idle/frozen
snapshots do not request repeated repaints, and hover changes invalidate only
controls and the help strip. FFT size, analysis cadence and trace sampling remain
unchanged. See PERFORMANCE.md (PERFORMANCE.md, retained research) for repeatable timings and scope.
The FFT needs 8192 samples to fill (171 ms at 48 kHz); initial spectra include zero padding. RMS and correlation use the latest analysis hop. The other panels display the latest result at about 30 Hz; short histories and clip latches retain transient information. Trace persistence is four UI refreshes, and XY shows the most recent 2048 paired samples rather than promising continuous oscilloscope-art playback at all sample rates. An analysis gap, stop, rate change, layout change or reset clears history. NaN/infinite samples are contained in analysis only; the output bitstream is not sanitized or limited. Clip indicators are not a safety limiter.
Normal audio sample rates are the target. Finite rates from 1 Hz to 10 MHz are accepted for transparent processing and SDK validator robustness; the fixed FFT has correspondingly limited frequency/time resolution at extreme rates.
Evidence: StudioAnalyzer/README.md.
Useful edge-case evidence
The independent tests cover coherent tones across 8/44.1/48/96/192 kHz, mono and anti-phase correlation, silence, DC, Nyquist limits, clipping latches, invalid analysis samples and a known transient train. Silence correlation is undefined rather than assigned a misleading +1 or zero-confidence value.
The queue tests fill, drain and wrap the bounded packet ring, then verify 10,000 concurrently transferred stereo packets for order and intact paired samples. History scrolling is tested with batched delivery, freeze, reset and a long stall. These are separate checks: a smooth animation does not prove that the channels came from the same sample index.
Applying the findings
Choose reference signals with analytical expected results before tuning the visual appearance. Check a coherent tone, DC, a one-channel tone, anti-phase stereo and silence. Apply optional display tilt after calibration and label it as presentation, not a change to the measured audio.
Keep analysis timing tied to samples. Let the UI interpolate presentation and drop obsolete visualization backlog under a declared bound, while audio processing continues independently. Compare the complete output bitstream to input when the effect is intended to be transparent; analysis sanitization must not quietly become an audio limiter.
Limits and open questions
The FFT size trades time resolution for frequency resolution; 8192 samples need about 171 ms at 48 kHz. Pixel averaging and window scalloping differ from a single coherent-bin reading. Onset classification is heuristic. UI buffering is not audio latency, and a clip indicator does not provide output protection.
Primary references
Research provenance
The methods and results above are drawn from these retained research records. Dates and product versions inside the article identify the scope of each experiment; publication review does not mean the hardware or numerical tests were rerun.
StudioAnalyzer/tests/analysis_tests.cpp— SHA-256adbf62efdd5af7ee8a8cb24f94ad645c1643c8cee528ae12f5ae383ae627328cStudioAnalyzer/README.md— SHA-256d5daf60718d3b3c61518fdeae2650f002106b366556fa09f7efd4e4a06c57eaa